Galaxy Monitoring with Telegraf and Grafana
Contributors
Questions
How to monitor Galaxy with Telegraf
How do I set up InfluxDB
How can I make graphs in Grafana?
How can I best alert on important metrics?
Objectives
Setup InfluxDB
Setup Telegraf
Setup Grafana
Create several charts
last_modification Published: Jan 31, 2019
last_modification Last Updated: Aug 8, 2024
Telegraf, InfluxDB, and Grafana
General purpose tools for monitoring systems and services.
| Tool | Use |
|---|---|
| Telegraf | plugin-driven server agent for collecting & reporting metrics |
| Influxdb | purpose built time series database |
| Grafana | dashboard for beautiful analytics and monitoring |
Dataflow:
- Galaxy produces data
- Telegraf consumes and buffers it, before sending it to
- InfluxDB which stores the data
- And Grafana is used to visualise it
Speaker Notes
- Monitoring in Galaxy is easy to setup.
- Galaxy produces data, which is consumed by telegraf.
- telegrafends data to Influx DB.
- This data is visualized in Grafana.
Grafana showcase
- usegalaxy.eu public server
- usegalaxy.org.au public server
- usegalaxy.org private server
If you see a dashboard you can export its configuration and put it on your Grafana with your data. Copy away!
Speaker Notes
- We have several public Grafana servers.
- If you like any of our graphs, you can copy them.

Speaker Notes
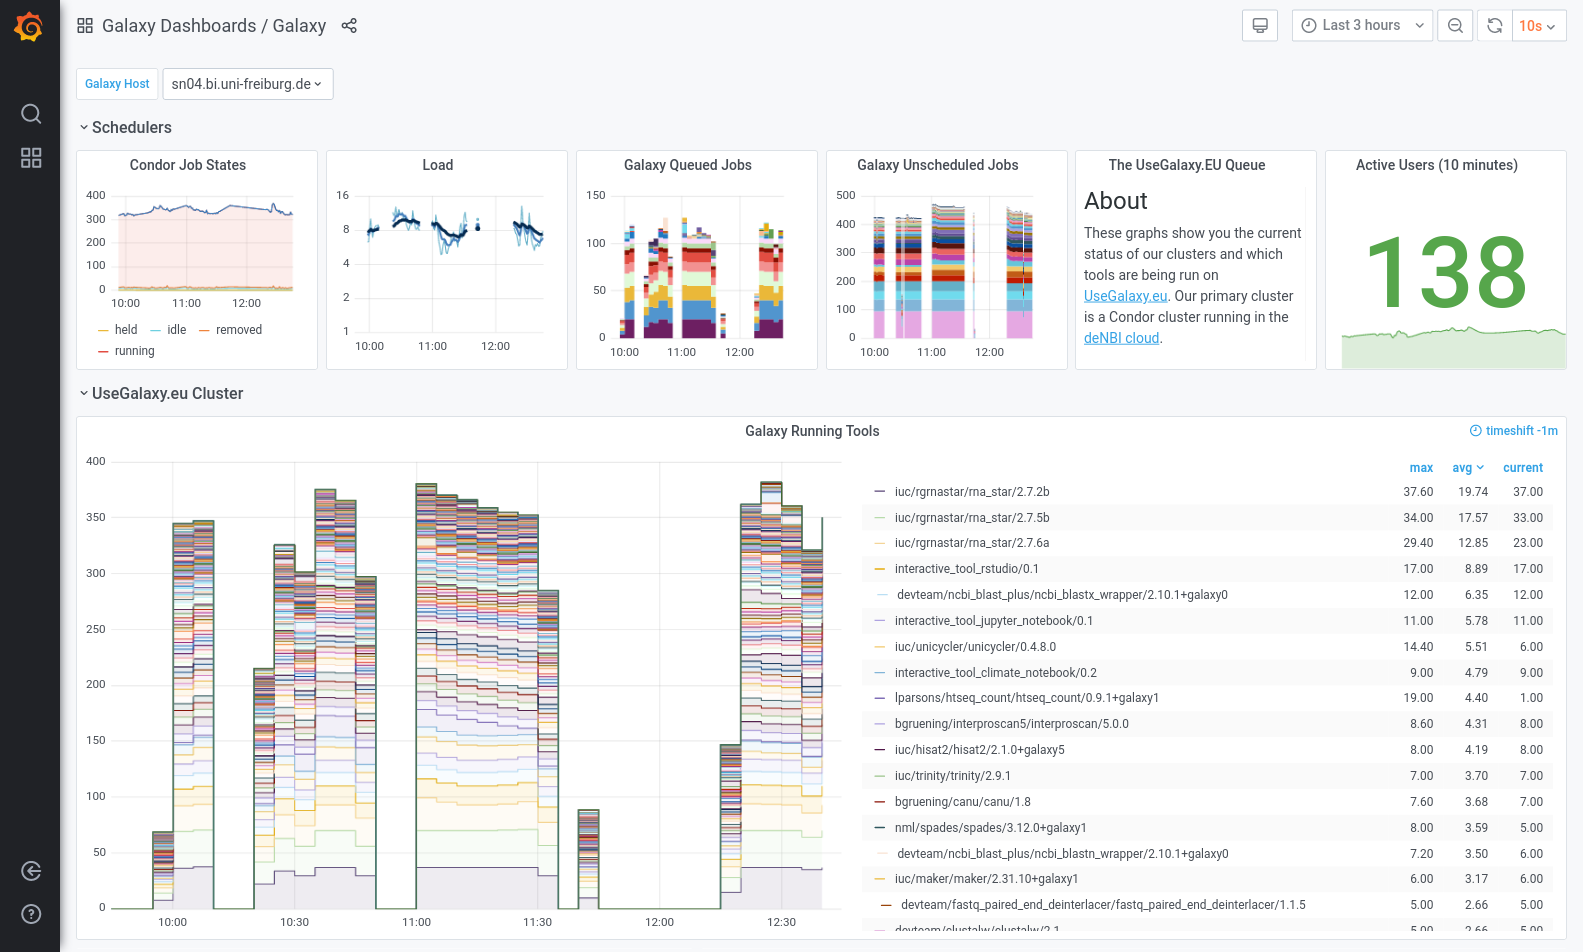
- We have built numerous dashboards for monitoring Galaxy.
- These include scripts and playbooks and configuration for everything.
- Here is EU’s galaxy dashboard showing active users, running and unscheduled jobs, etc.

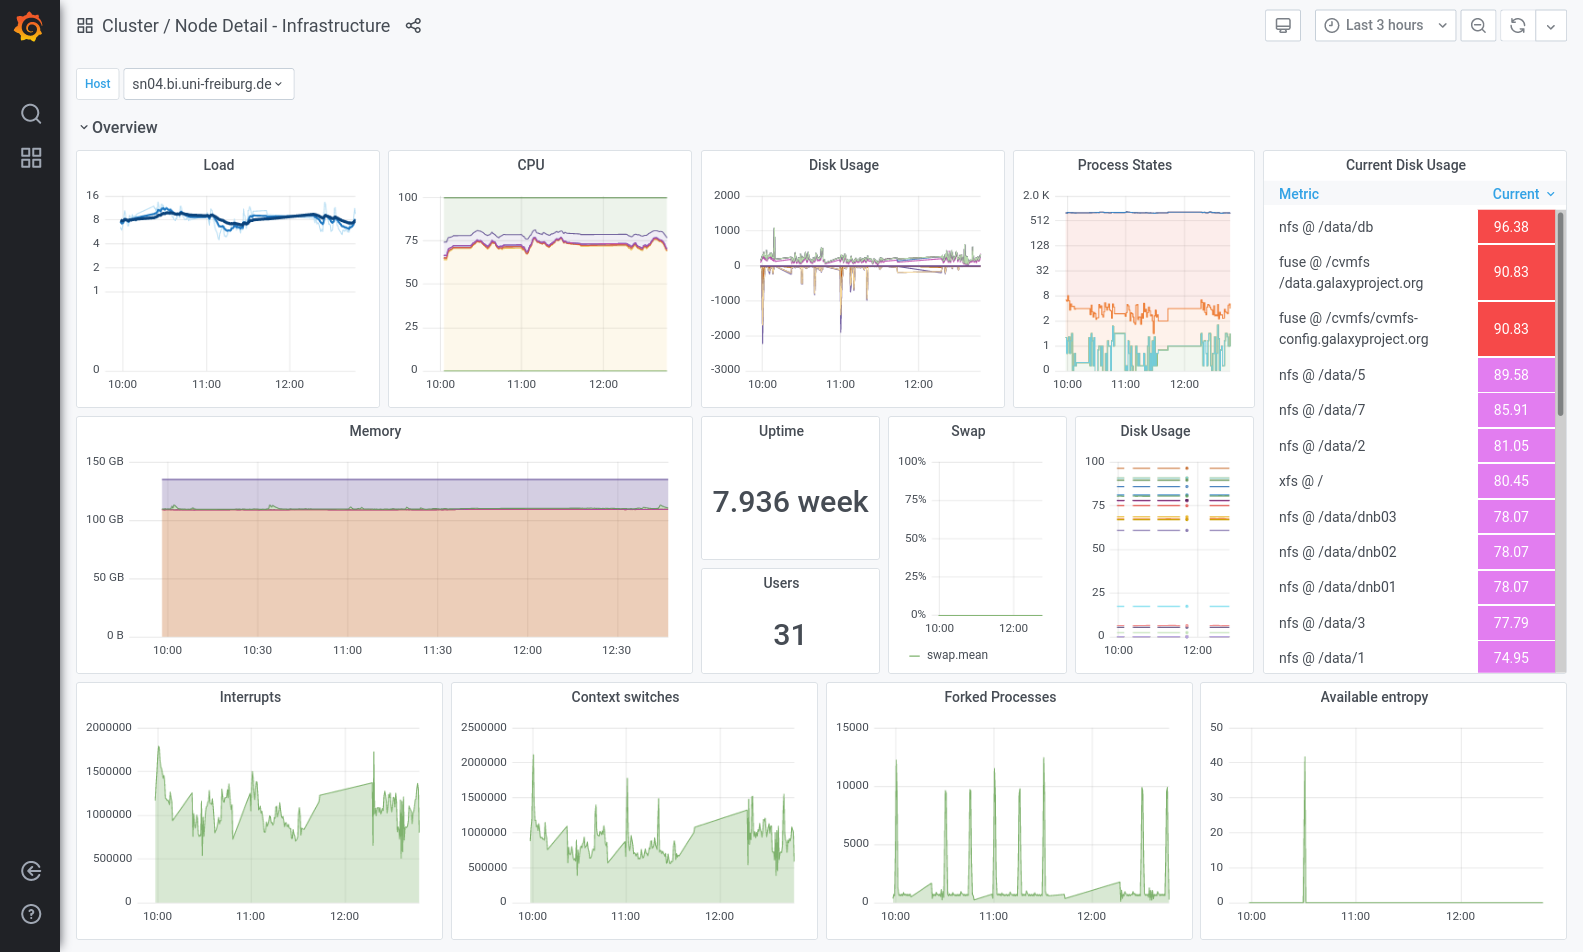
Speaker Notes
- However sometimes we notice something going wrong with our infrastructure.
- We use the node detail dashboard to begin our investigation.
- It gives us a very fast overview of the server.
- This can help efficiently pinpoint isuses.

Speaker Notes
- We also monitor the database heavily.
- All of this monitoring is built into telegraf.
- We need to be able to correlate latency with autovacuums or contention.
- We monitor table size changes to check for anomalies.

Speaker Notes
- Our staff often needs to report numbers for their grants.
- We produced this user statistics dashboard to help them.
- Now they can answer their own questions, and make their own graphs, without admin help.

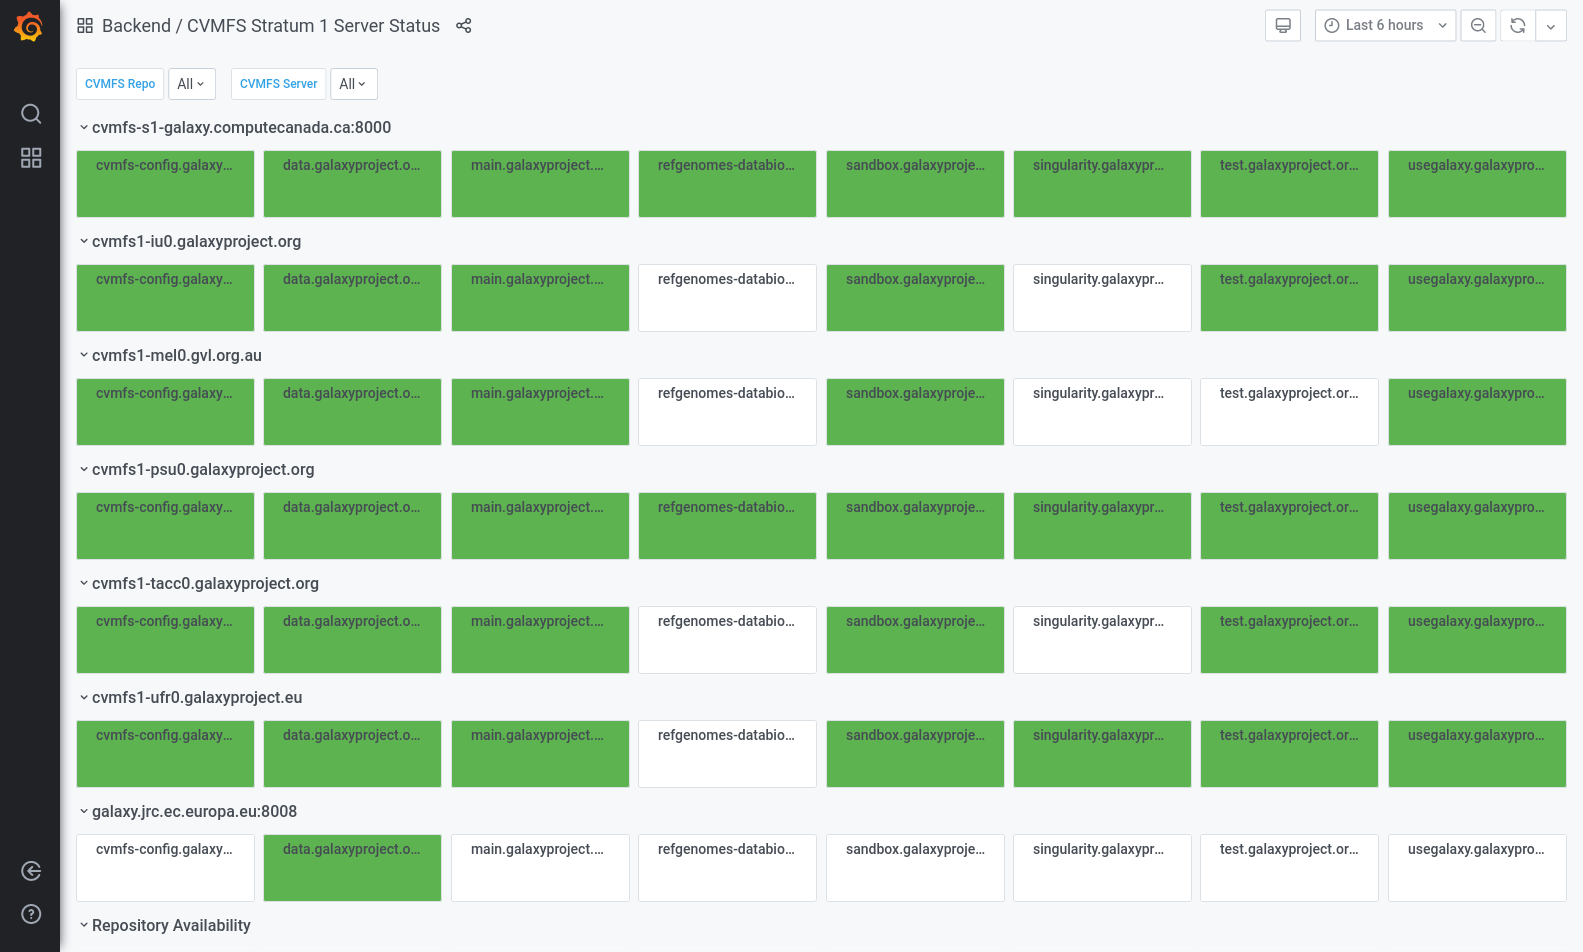
Speaker Notes
- We don’t just monitor Galaxy though.
- We also monitor CVMFS, and the availability of repositories in each server.
- This can give a good view of which repositories are replicated.
Key Points
- Telegraf provides an easy solution to monitor servers
- Galaxy can send metrics to Telegraf
- Telegraf can run arbitrary commands like `gxadmin`, which provides influx formatted output
- InfluxDB can collect metrics from Telegraf
- Use Grafana to visualise these metrics, and monitor their values
Thank you!
This material is the result of a collaborative work. Thanks to the Galaxy Training Network and all the contributors! Tutorial Content is licensed under
Creative Commons Attribution 4.0 International License.