View markdown source on GitHub

Introduction to ChIP-Seq data analysis

Contributors

last_modification Published: Jun 12, 2017
last_modification Last Updated: Mar 5, 2024

What is ChIP sequencing?


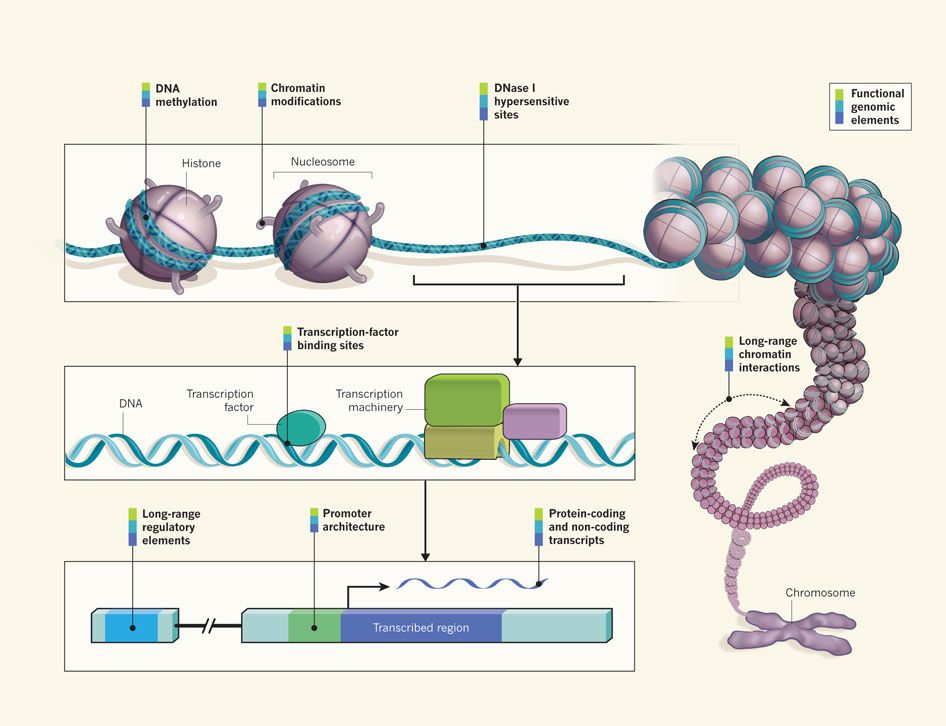
Where my data comes from?

Cartoon showing the histones forming part of the chromosome. Various insets zoom in from the DNase I hypersensitive sites to DNA with transcription factors and binding sites, which zooms into a block diagram of a gene. Ecker et al, Nature, 2012


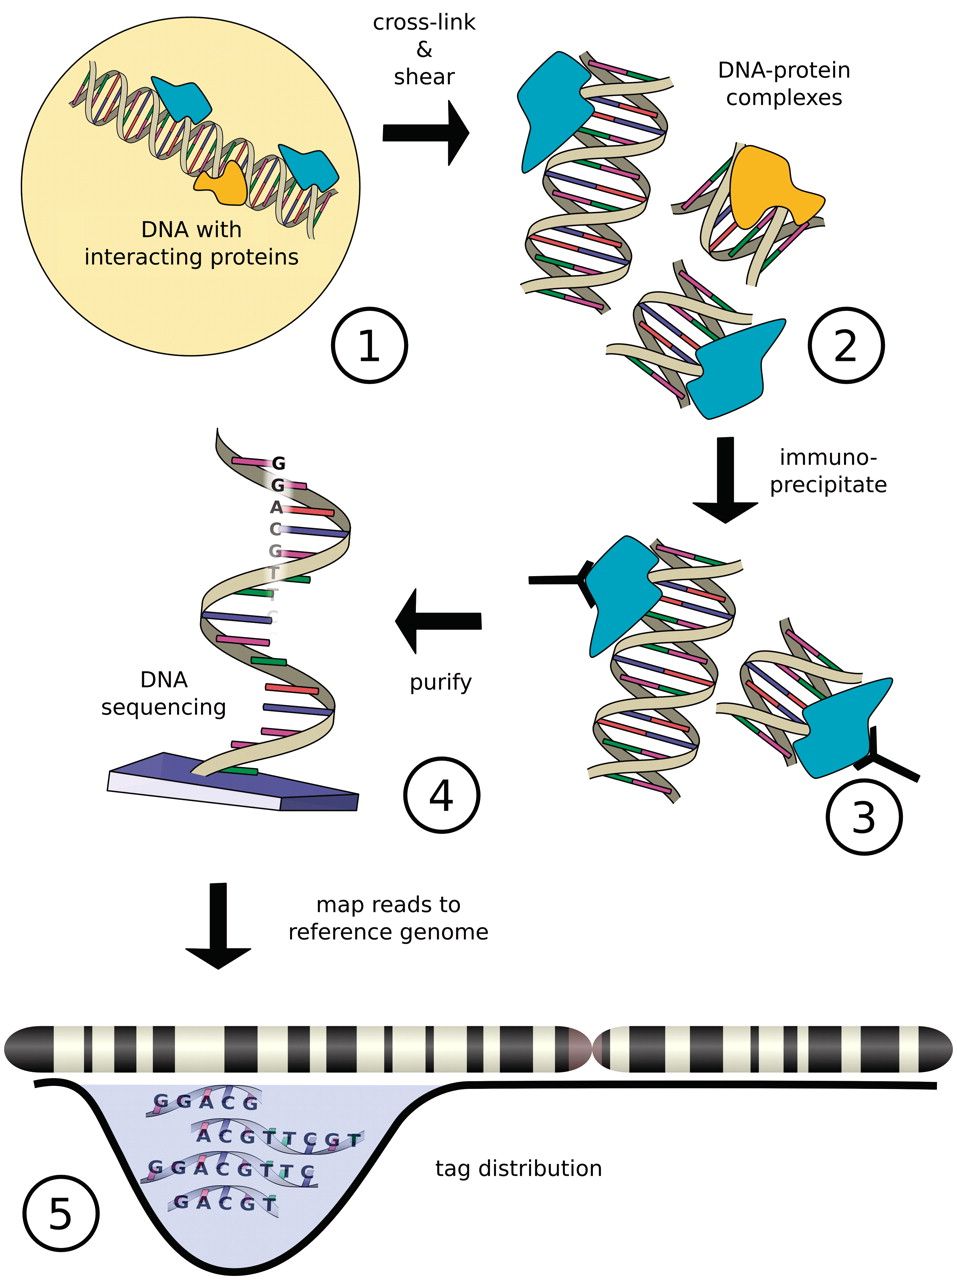
Chromatin immuno-precipitation

Cartoon of Chromatin immuno-precipitation. DNA interacts with proteins, this is cross-linked and sheared into DNA-protein complexes, immunoprecipitated, purified, and the bound DNA is sequenced. This is then mapped to a reference genome and the tag distribution is plotted along a chromosome.

Szalkowski & Schmid, Brief Bioinform, 2011


How to analyze ChIP-seq data?


Common procedures for ChIP-seq data analysis
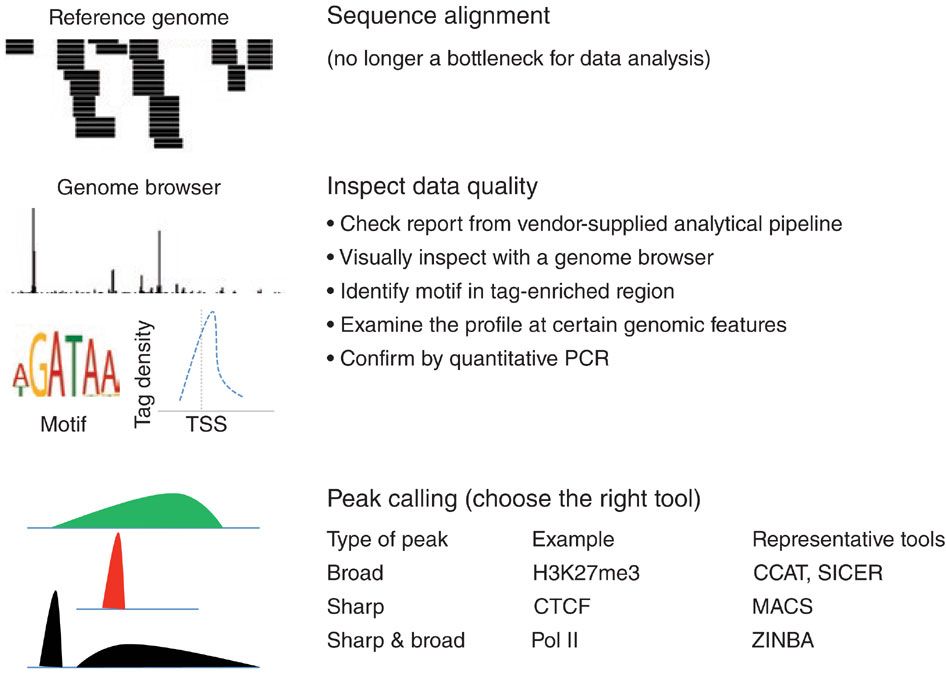
Complex graphic with the first step being Sequence alignment. Then Inpsect data quality with several substeps and graphics shown genome browser, motifs, and a chart of tag density vs tss. Lastly is peak calling, for broad peaks CCAT and SICER, for Sharp peaks MACS, and for both ZINBA.

Kidder et al, Nature Immunology, 2011


Thank you!

This material is the result of a collaborative work. Thanks to the Galaxy Training Network and all the contributors! Galaxy Training Network Tutorial Content is licensed under Creative Commons Attribution 4.0 International License.