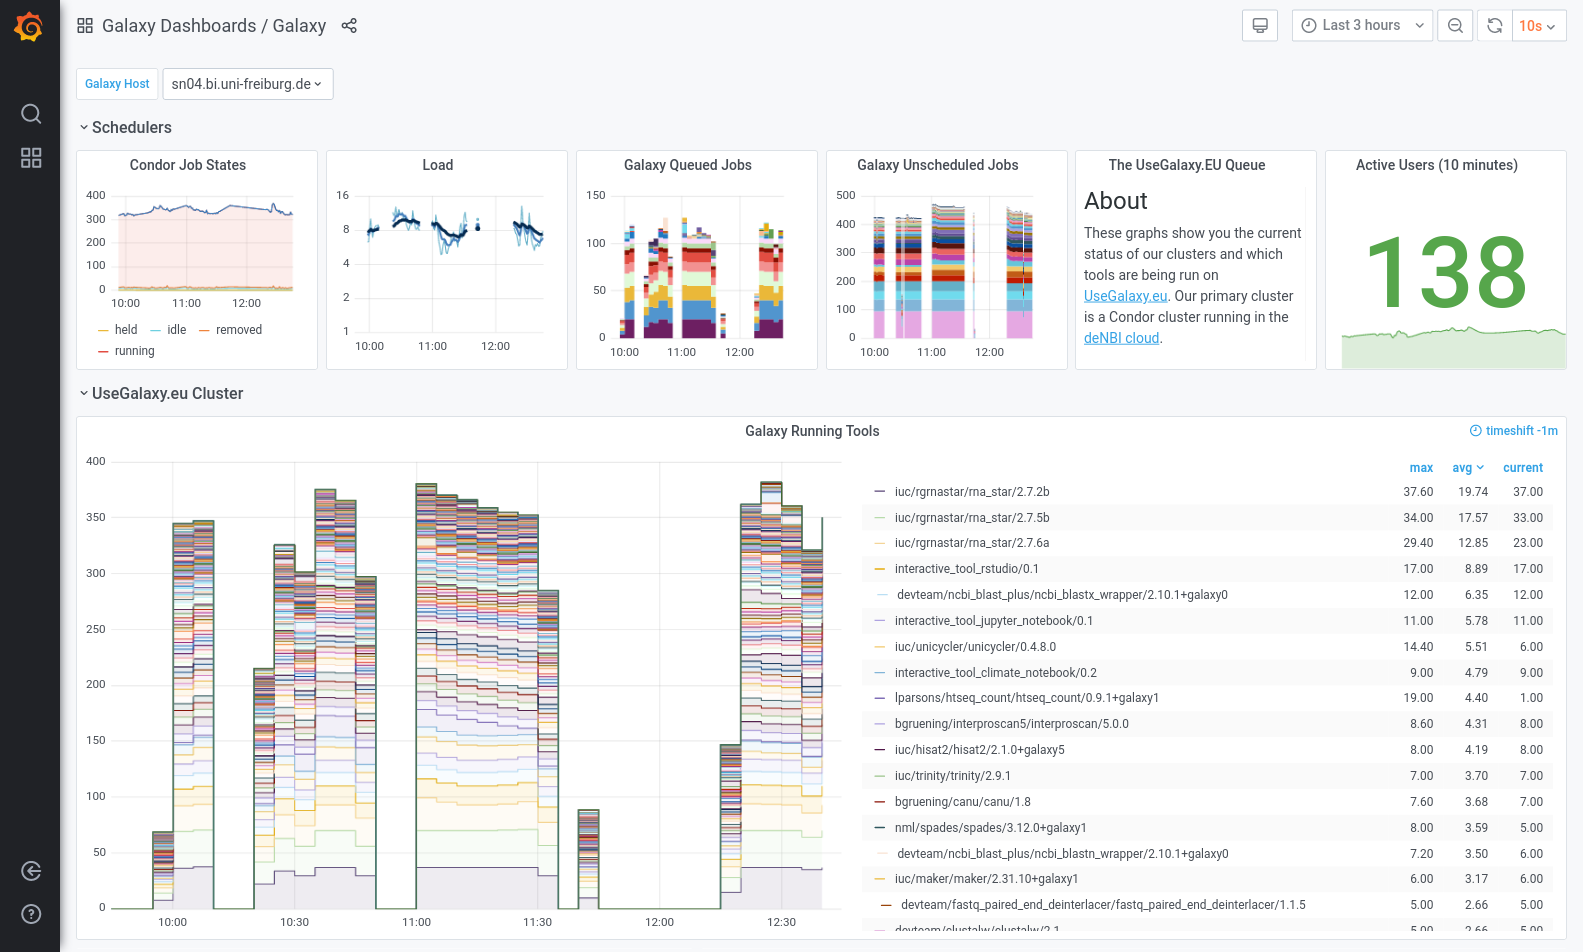
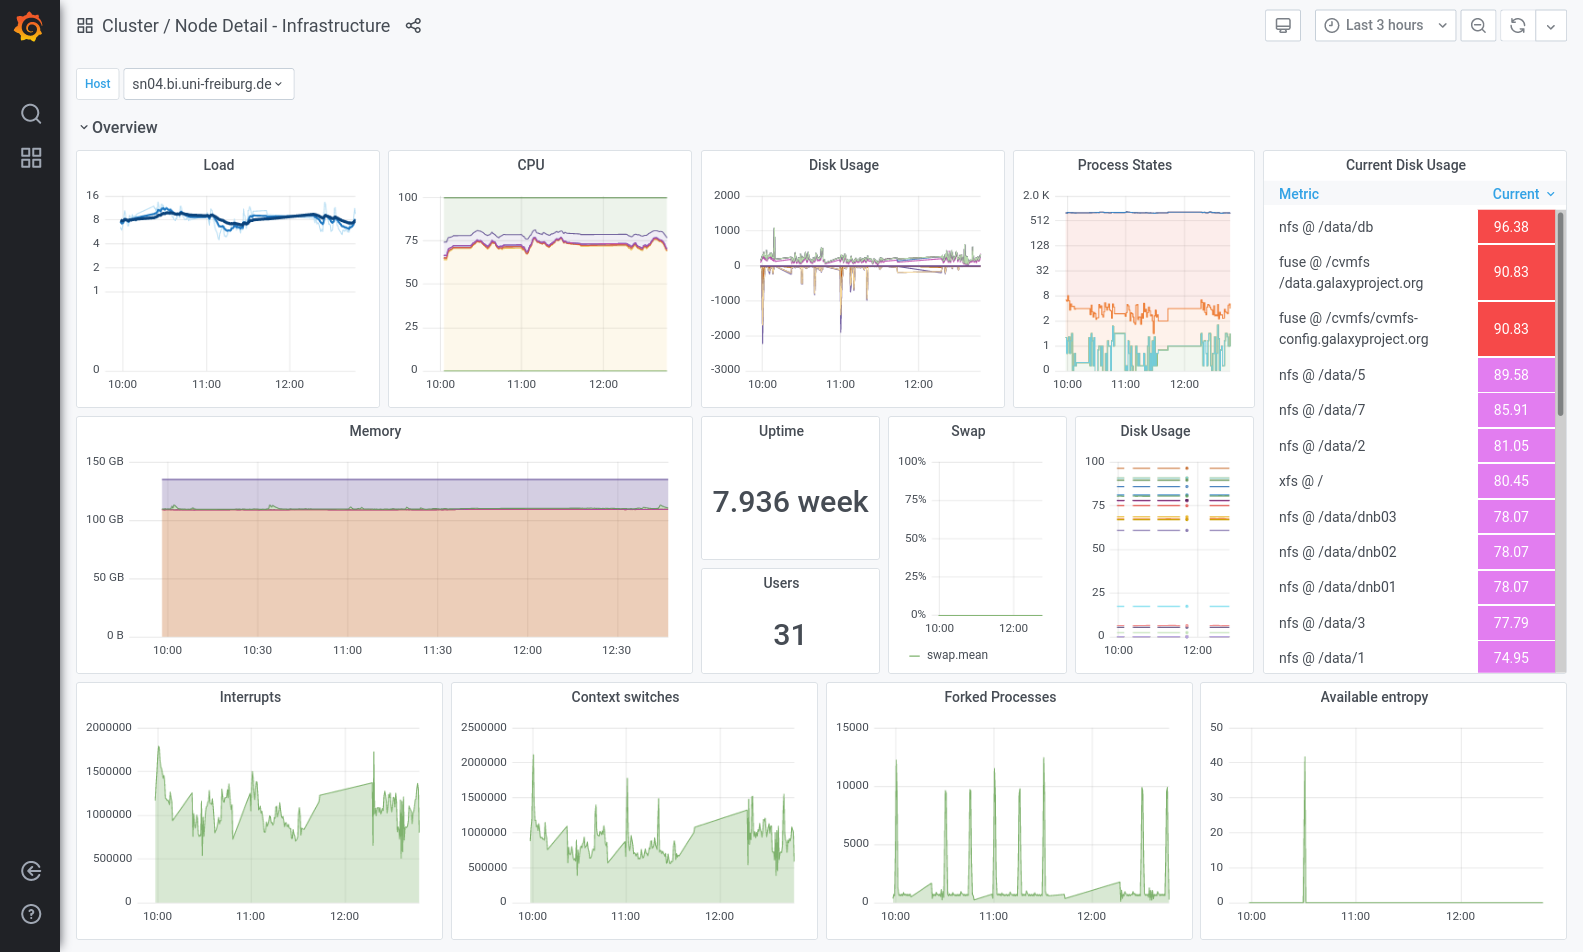
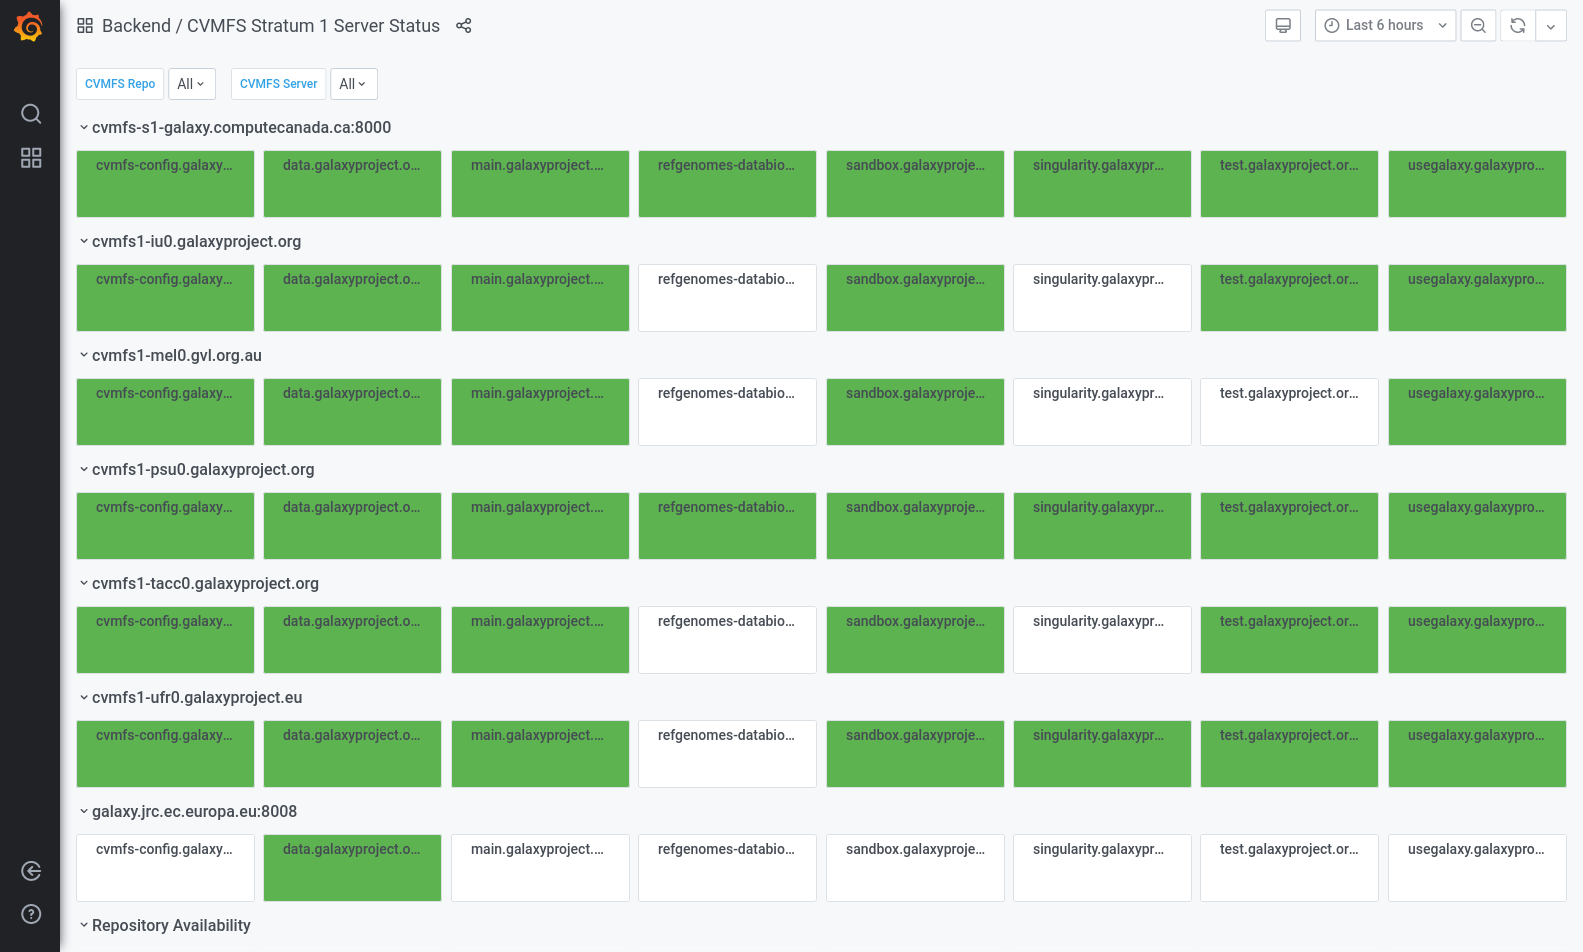
name: inverse layout: true class: center, middle, inverse <div class="my-header"><span> <a href="/training-material/topics/admin" title="Return to topic page" ><i class="fa fa-level-up" aria-hidden="true"></i></a> <a href="https://github.com/galaxyproject/training-material/edit/main/topics/admin/tutorials/monitoring/slides.html"><i class="fa fa-pencil" aria-hidden="true"></i></a> </span></div> <div class="my-footer"><span> <img src="/training-material/assets/images/gat.png" alt="page logo" style="height: 40px;"/> </span></div> --- <img src="/training-material/assets/images/gat.png" alt="page logo" class="cover-logo" /> <br/> <br/> # Galaxy Monitoring with Telegraf and Grafana <br/> <br/> <div markdown="0"> <div class="contributors-line"> <ul class="text-list"> <li> <a href="/training-material/hall-of-fame/natefoo/" class="contributor-badge contributor-natefoo"><img src="/training-material/assets/images/orcid.png" alt="orcid logo" width="36" height="36"/><img src="https://avatars.githubusercontent.com/natefoo?s=36" alt="Nate Coraor avatar" width="36" class="avatar" /> Nate Coraor</a> <li> <a href="/training-material/hall-of-fame/bgruening/" class="contributor-badge contributor-bgruening"><img src="/training-material/assets/images/orcid.png" alt="orcid logo" width="36" height="36"/><img src="https://avatars.githubusercontent.com/bgruening?s=36" alt="Björn Grüning avatar" width="36" class="avatar" /> Björn Grüning</a> <li> <a href="/training-material/hall-of-fame/slugger70/" class="contributor-badge contributor-slugger70"><img src="/training-material/assets/images/orcid.png" alt="orcid logo" width="36" height="36"/><img src="https://avatars.githubusercontent.com/slugger70?s=36" alt="Simon Gladman avatar" width="36" class="avatar" /> Simon Gladman</a> <li> <a href="/training-material/hall-of-fame/hexylena/" class="contributor-badge contributor-hexylena"><img src="/training-material/assets/images/orcid.png" alt="orcid logo" width="36" height="36"/><img src="https://avatars.githubusercontent.com/hexylena?s=36" alt="Helena Rasche avatar" width="36" class="avatar" /> Helena Rasche</a></li> </ul> </div> </div> <!-- modified date --> <div class="footnote" style="bottom: 8em;"> <i class="far fa-calendar" aria-hidden="true"></i><span class="visually-hidden">last_modification</span> Updated: <i class="fas fa-fingerprint" aria-hidden="true"></i><span class="visually-hidden">purl</span><abbr title="Persistent URL">PURL</abbr>: <a href="https://gxy.io/GTN:S00017">gxy.io/GTN:S00017</a> </div> <!-- other slide formats (video and plain-text) --> <div class="footnote" style="bottom: 5em;"> <i class="far fa-play-circle" aria-hidden="true"></i><span class="visually-hidden">video-slides</span> <a href="/training-material/videos/watch.html?v=/admin/tutorials/monitoring/slides">Video slides</a> | <i class="fas fa-file-alt" aria-hidden="true"></i><span class="visually-hidden">text-document</span><a href="slides-plain.html"> Plain-text slides</a> | <div class="btn-group"> <!-- dropdown with all recordings --> <a href="/training-material/topics/admin/tutorials/monitoring/recordings/" class="btn btn-default dropdown-toggle topic-icon" data-toggle="dropdown" aria-expanded="false" title="Latest recordings of this material in the GTN Video Library"> <i class="fas fa-video" aria-hidden="true"></i><span class="visually-hidden">video</span> Recordings </a> <ul class="dropdown-menu"> <li><a class="dropdown-item" href="/training-material/topics/admin/tutorials/monitoring/recordings/index.html#lecture-recording-15-february-2021" title="View the recording for this tutorial"> <i class="fas fa-video" aria-hidden="true"></i><span class="visually-hidden">video</span> Lecture (February 2021) - 2m</a> </li> <li><a class="dropdown-item" href="/training-material/topics/admin/tutorials/monitoring/recordings/" title="View all recordings for this tutorial"> <i class="fas fa-video" aria-hidden="true"></i><span class="visually-hidden">video</span> View All</a> </li> </ul> </div> </div> <!-- usage tips --> <div class="footnote" style="bottom: 2em;"> <strong>Tip: </strong>press <kbd>P</kbd> to view the presenter notes | <i class="fa fa-arrows" aria-hidden="true"></i><span class="visually-hidden">arrow-keys</span> Use arrow keys to move between slides </div> ??? Presenter notes contain extra information which might be useful if you intend to use these slides for teaching. Press `P` again to switch presenter notes off Press `C` to create a new window where the same presentation will be displayed. This window is linked to the main window. Changing slides on one will cause the slide to change on the other. Useful when presenting. --- ### <i class="far fa-question-circle" aria-hidden="true"></i><span class="visually-hidden">question</span> Questions - How to monitor Galaxy with Telegraf - How do I set up InfluxDB - How can I make graphs in Grafana? - How can I best alert on important metrics? --- ### <i class="fas fa-bullseye" aria-hidden="true"></i><span class="visually-hidden">objectives</span> Objectives - Setup InfluxDB - Setup Telegraf - Setup Grafana - Create several charts --- # Telegraf, InfluxDB, and Grafana General purpose tools for monitoring systems and services. Tool | Use --- | --- [Telegraf](https://github.com/influxdata/telegraf) | plugin-driven server agent for collecting & reporting metrics [Influxdb](https://github.com/influxdata/influxdb/) | purpose built time series database [Grafana](https://grafana.com/) | dashboard for beautiful analytics and monitoring Dataflow: - Galaxy produces data - Telegraf consumes and buffers it, before sending it to - InfluxDB which stores the data - And Grafana is used to visualise it ??? - Monitoring in Galaxy is easy to setup. - Galaxy produces data, which is consumed by telegraf. - telegrafends data to Influx DB. - This data is visualized in Grafana. --- # Grafana showcase * usegalaxy.eu [public server](https://stats.galaxyproject.eu) * usegalaxy.org.au [public server](https://stats.genome.edu.au) * usegalaxy.org private server If you see a dashboard you can export its configuration and put it on your Grafana with your data. Copy away! ??? - We have several public Grafana servers. - If you like any of our graphs, you can copy them. ---  ??? - We have built numerous dashboards for monitoring Galaxy. - These include scripts and playbooks and configuration for everything. - Here is EU's galaxy dashboard showing active users, running and unscheduled jobs, etc. ---  ??? - However sometimes we notice something going wrong with our infrastructure. - We use the node detail dashboard to begin our investigation. - It gives us a very fast overview of the server. - This can help efficiently pinpoint isuses. ---  ??? - We also monitor the database heavily. - All of this monitoring is built into telegraf. - We need to be able to correlate latency with autovacuums or contention. - We monitor table size changes to check for anomalies. ---  ??? - Our staff often needs to report numbers for their grants. - We produced this user statistics dashboard to help them. - Now they can answer their own questions, and make their own graphs, without admin help. ---  ??? - We don't just monitor Galaxy though. - We also monitor CVMFS, and the availability of repositories in each server. - This can give a good view of which repositories are replicated. --- ### <i class="fas fa-key" aria-hidden="true"></i><span class="visually-hidden">keypoints</span> Key points - Telegraf provides an easy solution to monitor servers - Galaxy can send metrics to Telegraf - Telegraf can run arbitrary commands like `gxadmin`, which provides influx formatted output - InfluxDB can collect metrics from Telegraf - Use Grafana to visualise these metrics, and monitor their values --- ## Thank You! This material is the result of a collaborative work. Thanks to the [Galaxy Training Network](https://training.galaxyproject.org) and all the contributors! <div markdown="0"> <div class="contributors-line"> <table class="contributions"> <tr> <td><abbr title="These people wrote the bulk of the tutorial, they may have done the analysis, built the workflow, and wrote the text themselves.">Author(s)</abbr></td> <td> <a href="/training-material/hall-of-fame/natefoo/" class="contributor-badge contributor-natefoo"><img src="/training-material/assets/images/orcid.png" alt="orcid logo" width="36" height="36"/><img src="https://avatars.githubusercontent.com/natefoo?s=36" alt="Nate Coraor avatar" width="36" class="avatar" /> Nate Coraor</a><a href="/training-material/hall-of-fame/bgruening/" class="contributor-badge contributor-bgruening"><img src="/training-material/assets/images/orcid.png" alt="orcid logo" width="36" height="36"/><img src="https://avatars.githubusercontent.com/bgruening?s=36" alt="Björn Grüning avatar" width="36" class="avatar" /> Björn Grüning</a><a href="/training-material/hall-of-fame/slugger70/" class="contributor-badge contributor-slugger70"><img src="/training-material/assets/images/orcid.png" alt="orcid logo" width="36" height="36"/><img src="https://avatars.githubusercontent.com/slugger70?s=36" alt="Simon Gladman avatar" width="36" class="avatar" /> Simon Gladman</a><a href="/training-material/hall-of-fame/hexylena/" class="contributor-badge contributor-hexylena"><img src="/training-material/assets/images/orcid.png" alt="orcid logo" width="36" height="36"/><img src="https://avatars.githubusercontent.com/hexylena?s=36" alt="Helena Rasche avatar" width="36" class="avatar" /> Helena Rasche</a> </td> </tr> <tr class="reviewers"> <td><abbr title="These people reviewed this material for accuracy and correctness">Reviewers</abbr></td> <td> <a href="/training-material/hall-of-fame/hexylena/" class="contributor-badge contributor-badge-small contributor-hexylena"><img src="https://avatars.githubusercontent.com/hexylena?s=36" alt="Helena Rasche avatar" width="36" class="avatar" /></a><a href="/training-material/hall-of-fame/nsoranzo/" class="contributor-badge contributor-badge-small contributor-nsoranzo"><img src="https://avatars.githubusercontent.com/nsoranzo?s=36" alt="Nicola Soranzo avatar" width="36" class="avatar" /></a><a href="/training-material/hall-of-fame/martenson/" class="contributor-badge contributor-badge-small contributor-martenson"><img src="https://avatars.githubusercontent.com/martenson?s=36" alt="Martin Čech avatar" width="36" class="avatar" /></a><a href="/training-material/hall-of-fame/shiltemann/" class="contributor-badge contributor-badge-small contributor-shiltemann"><img src="https://avatars.githubusercontent.com/shiltemann?s=36" alt="Saskia Hiltemann avatar" width="36" class="avatar" /></a><a href="/training-material/hall-of-fame/slugger70/" class="contributor-badge contributor-badge-small contributor-slugger70"><img src="https://avatars.githubusercontent.com/slugger70?s=36" alt="Simon Gladman avatar" width="36" class="avatar" /></a><a href="/training-material/hall-of-fame/bgruening/" class="contributor-badge contributor-badge-small contributor-bgruening"><img src="https://avatars.githubusercontent.com/bgruening?s=36" alt="Björn Grüning avatar" width="36" class="avatar" /></a></td> </tr> </table> </div> </div> <div style="display: flex;flex-direction: row;align-items: center;justify-content: center;"> <img src="/training-material/assets/images/gat.png" alt="page logo" style="height: 100px;"/> </div> Tutorial Content is licensed under <a rel="license" href="http://creativecommons.org/licenses/by/4.0/">Creative Commons Attribution 4.0 International License</a>.<br/>